|
matplotlib は、Excelに匹敵するグラフづくりを行うことができる。 |
下記の方法によりインストールを行う。
$ sudo apt-get update $ sudo apt-get upgrade $ sudo apt-get install python3-matplotlib |
|
例1 棒グラフ # matplotlib graphic program import matplotlib.pyplot as plt weight = [10,20,20,30,40,10] xvar = [1,2,3,4,5,6] plt.figure(figsize=(8,6), facecolor="lightcyan") plt.ylim(0, 60) plt.bar (xvar, weight, color="red") plt.show() 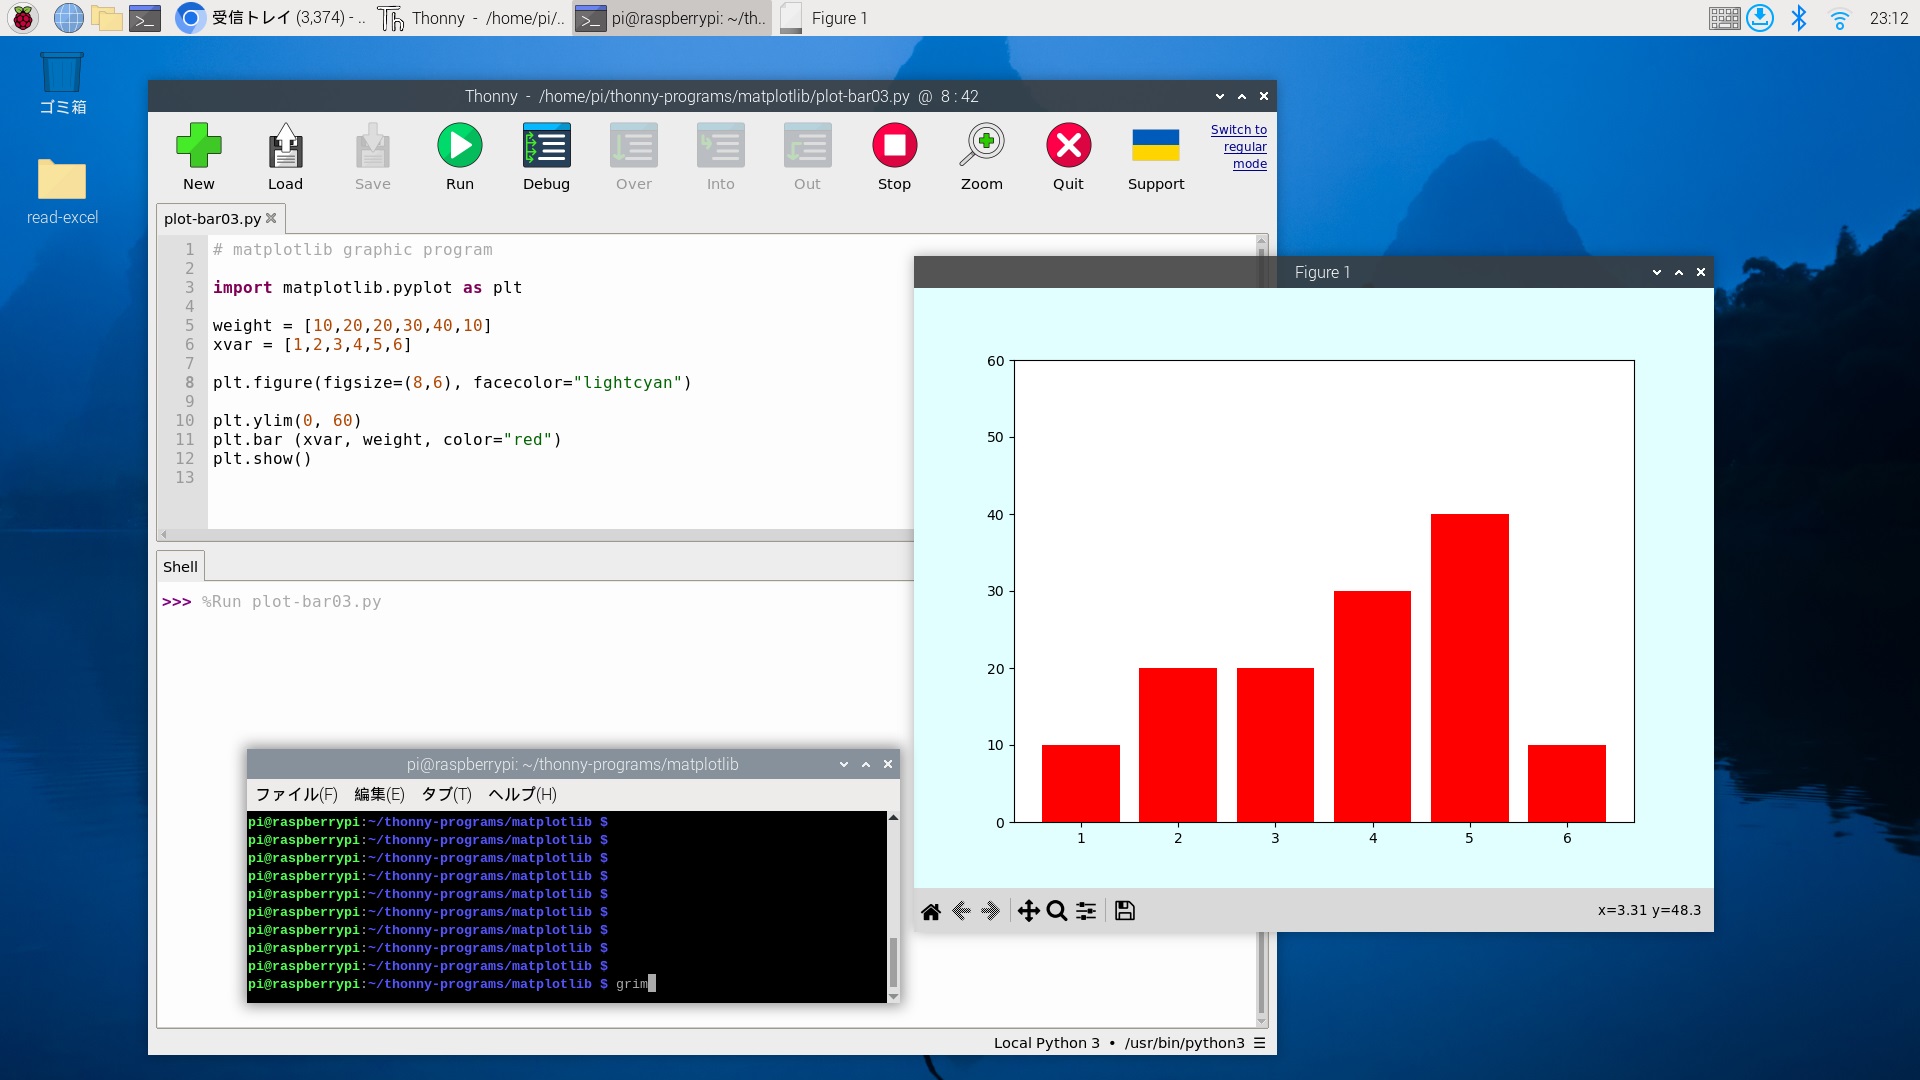 例2 折れ線グラフ ## matplotlib graphic program import matplotlib.pyplot as plt weight = [10,20,20,30,40,10] xvar = [1,2,3,4,5,6] plt.figure(figsize=(8,6), facecolor="orange") plt.ylim(0, 60) plt.plot (weight, marker="o", ms=20, linewidth=5,color="blue") plt.grid() plt.show() 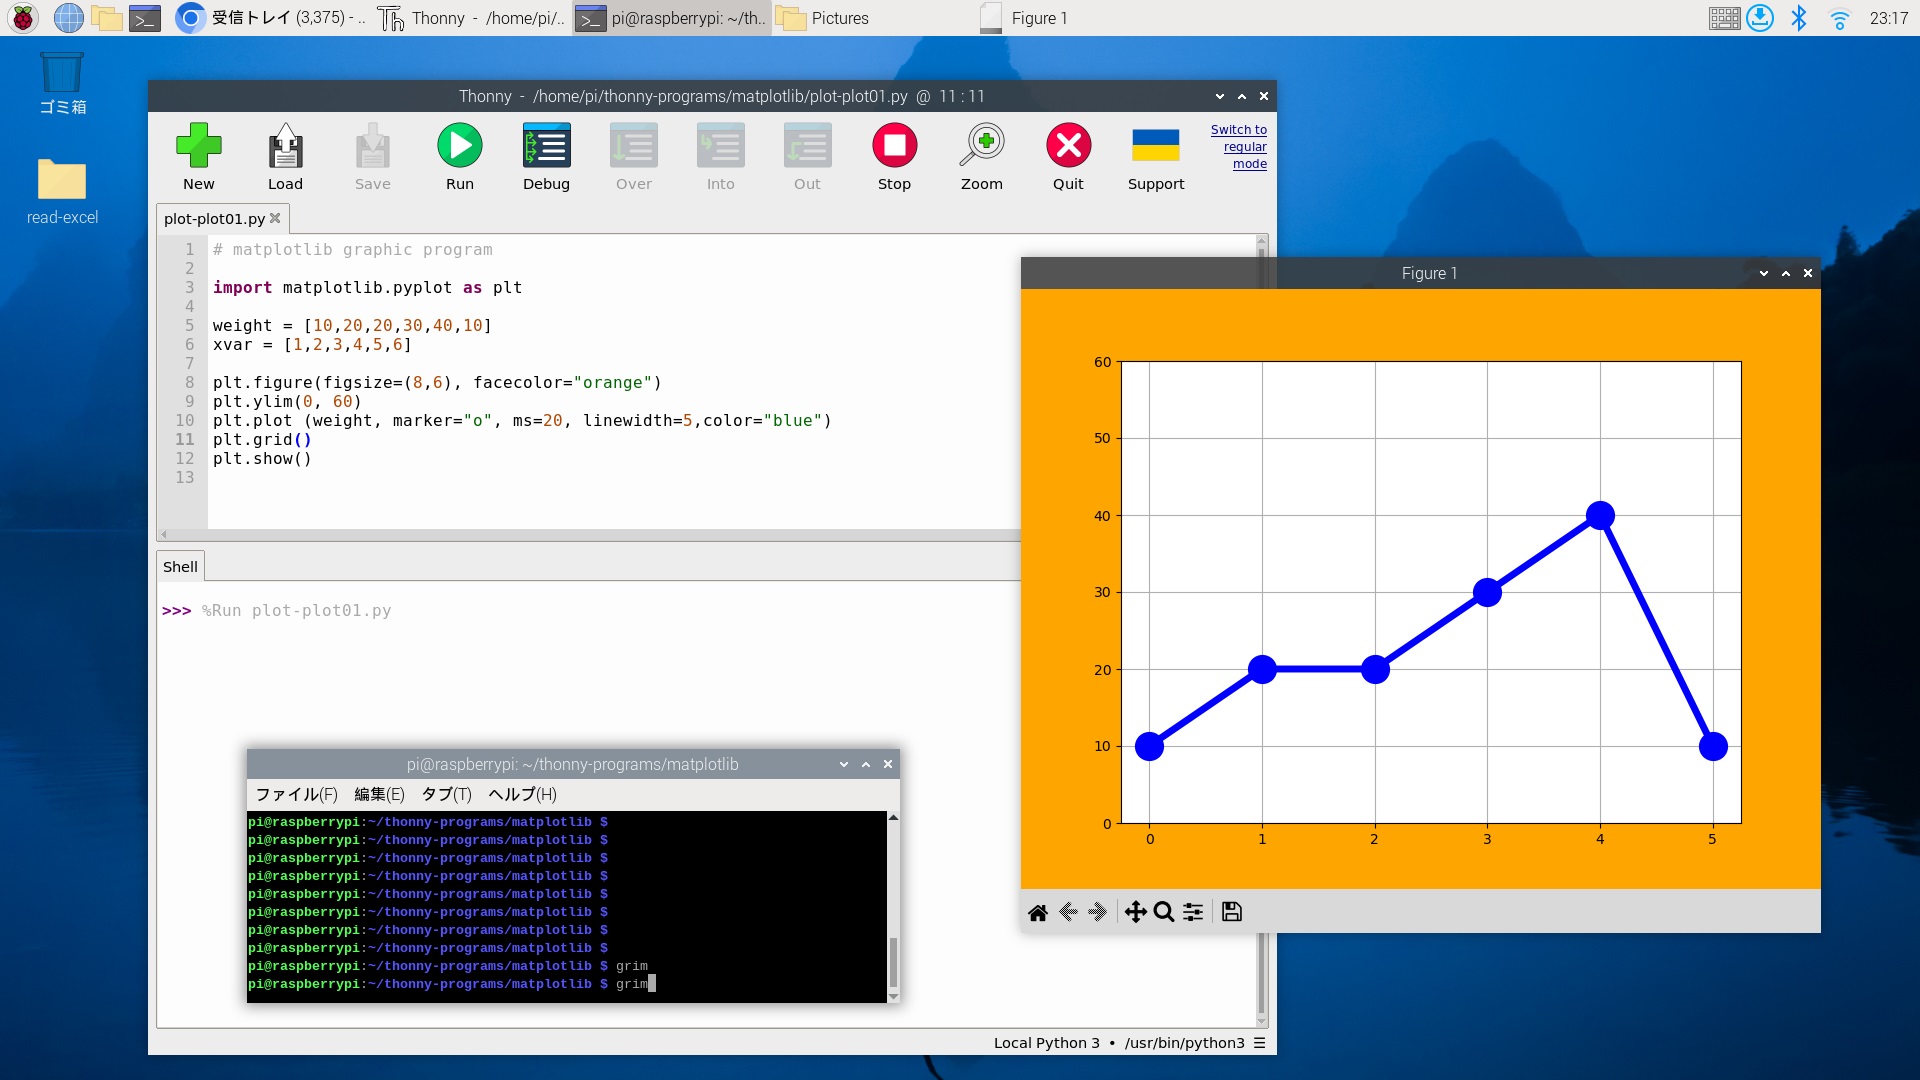 |
戻る